
 Most small business websites see conversion rates under 3%, matching HubSpot benchmarks. For example, the report shows e-commerce averages under 2%. This low performance often stems from viewing a site like static presentation brochures, not interactive tools that solve users’ pain points.
At its core, this perspective asks a direct question: Is your website a product? When you ask this question, you shift from seeing a page as a collection of text to seeing it as a tool that solves a specific user problem. A website functions as a product when it focuses on user actions, repeatable value, constant updates based on how people actually use it, and other crucial factors. Most founders struggle because traffic enters the site, but engagement stays low due to a lack of a clear funnel and pathways for the visitor to follow.
This guide was created after reviewing UX studies, small businesses’ growth case studies, and behavior analytics reports. Below, you can also find examples of how specific platforms and sites support a product-led mindset!
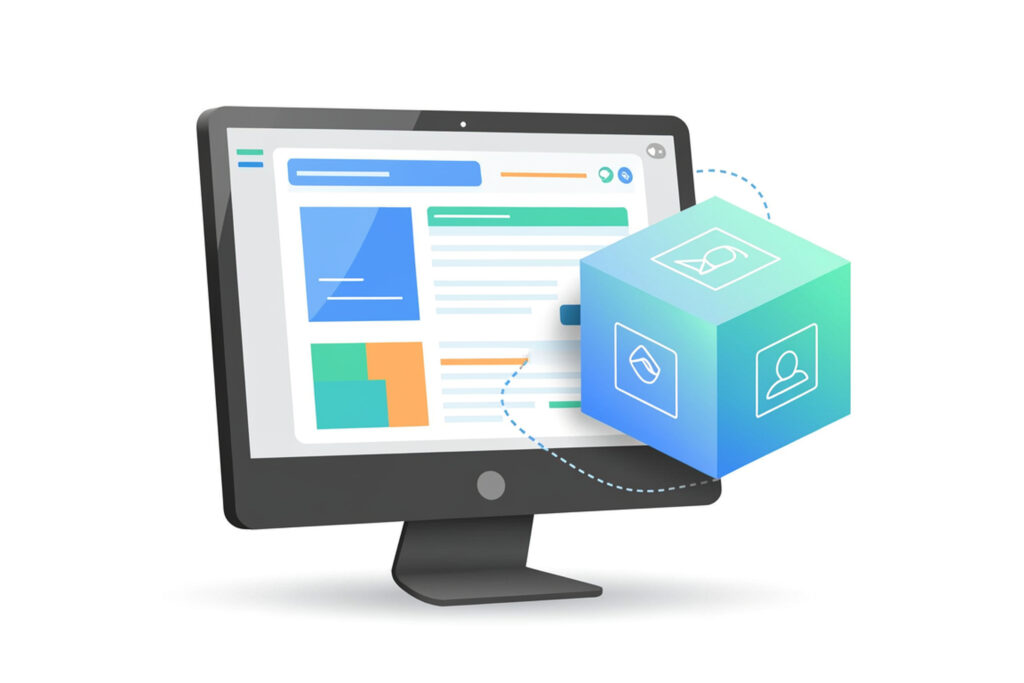
What Changes When You Treat Your Website Like a Product
A product-led website starts with user intent. Each page answers one need and supports one action. The structure becomes easier to follow because every element has a role.
Let’s take, for example, the Headway app website that focuses on nonfiction summaries. First, the site focuses on showing how the product fits into daily use. The homepage presents short summaries, app screens, and a clear entry point to start onboarding. Content sections explain how users can build a reading habit through short sessions. The flow moves from understanding the value to starting a personalized setup. The blog and examples support this path by showing real use cases:
- Hero section with app preview: Shows real interface screens with short summaries and a visible start button
- Onboarding entry point: Leads to a short questionnaire that defines user goals before signup
- Use case blocks: Explains how people use the app during short daily sessions
- Social proof elements: Includes ratings, user counts, and short testimonials near key actions
- Blog and content hub: Articles connect reading habits with product features and guide users back into the funnel
Clear Actions Improve User Behavior
Pages with a single clear action outperform those with scattered actions by 20-28%, according to 2026 CRO benchmarks. When users see a single path, they follow it 2-3x more often than on choice-overloaded CTAs and pages. When users see one clear path, they follow it more often.
Cognitive load refers to how much mental effort a person uses to process information. When a page shows too many options, messages, or actions, the brain needs more time to decide what to do.
Hick’s Law explains this effect. It states that the more choices a person has, the longer it takes them to make a decision. This principle has been tested in psychology and UX research for decades, and recent studies still confirm it. For a small business, this might mean placing visible one-action CTA buttons across the page. That button could lead to onboarding, a booking page, or a short form.
Navigation Alone Does Not Guide Users: Each Page Needs a Purpose
Navigation alone does not guide users. Sure, menus help users move between pages, though they do not create a structured journey. A product-led website uses a funnel, which means a sequence of steps designed to move users forward.
Let’s take, for example, a page of the Storyshorts site. It focuses on books and organizes them by category, library, and author. You land on a list of book summaries with clear previews and short descriptions. Each item gives enough context to understand the value, then leads you to a deeper page where you can read or listen to the summary. The path feels continuous because each step answers a specific question and points to the next action.
For example, a visitor might land on a page via a search result. That page explains the problem and shows a solution. A short section builds trust through ratings or usage data. A button or link leads to the next step, such as opening a full summary or downloading the app. Each step connects to the next one without gaps.
Main tip: Many websites try to explain everything at once, which only creates confusion. Users scan quickly, so they miss key points when too much information appears on a single screen. A better approach focuses each page on one outcome. A service page explains how the service works and leads to a booking step and so on. A pricing page explains cost and answers common concerns in the FAQ. This structure reduces friction and helps users decide faster.
Watching How Users Click with Tools
Many site owners do not know where their users drop off in the sign-up flow. For example, Hotjar’s tools focus on helping teams identify such drop-offs in user flows. However, that visibility is often missing when forms and sign-up journeys underperform. In any case, Hotjar records real sessions so you can see exactly where a visitor gets confused. You watch these recordings to find buttons that people ignore or forms that are too long.
When you treat your website as a product strategy, you need to identify these friction points. You can start reviewing heatmaps that show you which sections of your page get the most attention and which ones are invisible to your audience:
- Heatmaps show click, move, and scroll zones in bright colors.
- Session recordings replay visitors’ actual mouse movements.
- Feedback widgets collect direct user feedback as users browse.
- Filters let you see only sessions where a user abandoned their cart.
Tracking User Behavior Data with Google
Google Analytics remains the standard for measuring user actions, with millions of sites using it to map the user journey. You can check your bounce rate per page to see which content fails to retain website visitors. It shows you the path a person takes from their first click to their final purchase.
Data removes the guesswork from your marketing. You understand exactly which traffic sources provide the highest value and where users lose interest in your funnel, where you get:
- Event tracking monitors specific actions like button clicks or video plays.
- Funnel reports map out the steps users take toward a goal.
- Audience segments group users by location, device, or behavior.
- Real-time data shows you how many people are on your site right now, and more.
Planning Website Experiments
Teams using centralized knowledge bases like Notion report up to 73% higher usage and significantly less duplicate work by breaking down information silos. You can use Notion to organize your website tests and experiment results. You can keep ideas, dashboards, tasks in one place, and you can also document every change you make to the site and do much more. For example, you track the hypothesis, the change, and the final result in a database to build a history of what works for your audience with useful:
- Templates provide a structure for documenting A/B tests.
- Databases store results so you can compare old tests with new ones.
- Collaboration tools allow your team to comment on experiment designs.
- Tags group experiments by category, like SEO or UX.
Treat Your Website Like a Product and Keep Testing What Works
Treating your website as a product starts with a simple but powerful question: Is your website a product or just something you launched and left behind? Product thinking focuses on how to improve website engagement through constant testing rather than one-time launches. You can use data from tools like Google Analytics and Hotjar to see where visitors struggle.
This mindset helps you build a site that generates revenue and retains users over the long term. You can test one tool or strategy and observe how it changes the perspective on your site. You can adjust your digital presence step by step to better serve your customers.
Helpful information related to website building and marketing strategy can be found in this list of blogs here.